

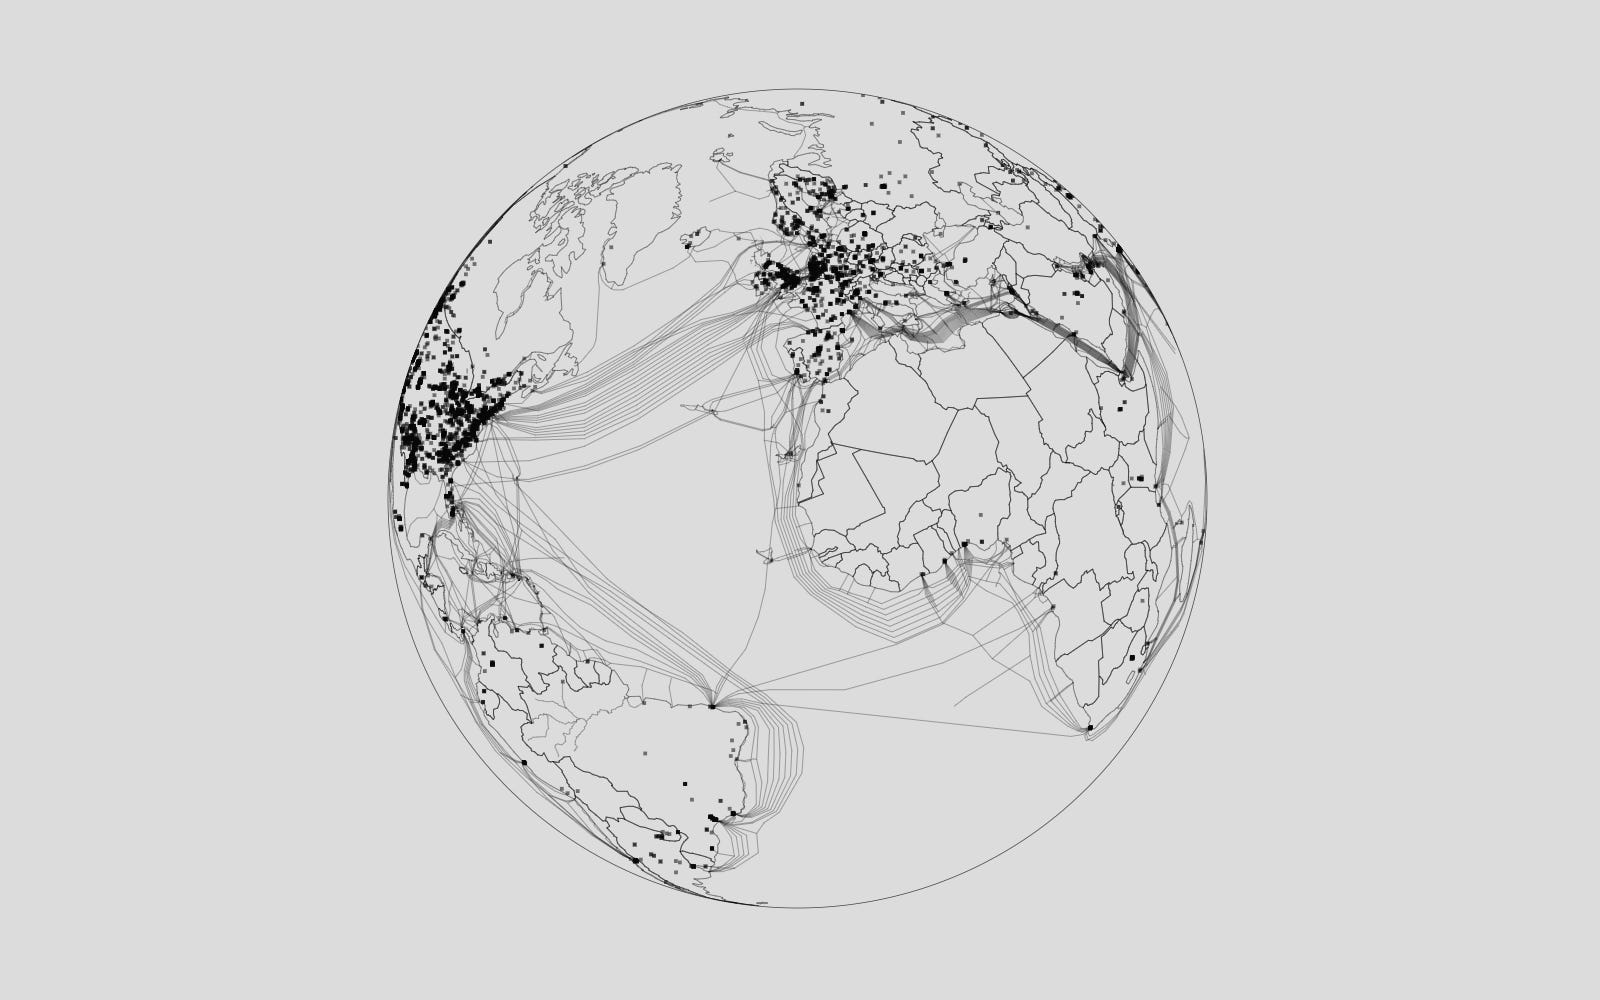
It’s been a while since I’ve written an article for Techno-Statecraft. A newborn, moving across the globe, and beginning a new job have kept me quite busy. While I was able to put out a few journal articles, most of the time I’ve had little space for writing for the newsletter. The politics surrounding data centers has reached something close to a fever pitch and has become a key aspect of American politics in a way I couldn’t have imagined two years ago—and had little anchor for case studies I had begun the newsletter with in early 2025. If you’ve followed Techno-Statecraft, I hope many of you have also become more aware of the extensive links between fossil fuels, finance, AI infrastructure, land, utilities, and local politics that have rapidly taken shape across the country and increasingly elsewhere. But keeping pace with the whirlwind of projects, protests, policy changes, lawsuits, permitting battles, and corporate announcements has become quite difficult and exhausting.
I have seen many attempts to keep pace with this through various trackers and databases. Some focus on bans, moratoria, and lawsuits; others on legislation, environmental impacts, proposed developments, or energy infrastructure. There is now a growing ecosystem of these including TrackPolicy, Data Centers Exposed, Data Center Buildout, Data Center Tracker, FracTracker, Data Center Policy (recommended), and others. Commercial sources such as Baxtel, Data Center Map, and Cleanview provide another layer of information but with a steep cost.
But in my own research, I kept running into the same problem. Most free trackers lacked validation, contained incorrect or incomplete information, or focused on only one dimension of development. Better proprietary data was often expensive and out of reach, particularly while I was between academic jobs and without a few thousand dollars to throw around. More importantly, none of these resources quite gave me what I was looking for: a way to connect the physical geography of data centers with the policies, infrastructure decisions, political conflicts, and developmental coalitions through which they were being built.
So, while I took the night shift with a newborn on my chest, and quite unable to write coherently, I took instead to data collection. In doing this research, I began using AI-assisted research methods to identify and summarize hundreds of articles, permitting records, legislative materials, company announcements, planning documents, and other official sources—learning, at the same time, the limits of such methods. And, being somewhat jealous of other MIT graduates who seemed far more technically capable in the coding department—see Infrastructure Research for example—I started vibe-coding a simple interface to help me connect the various dimensions of data center and infrastructure politics I was collecting. What began as my own attempt to find patterns and insights in a growing pile of data gradually turned into something much larger.
After several months of development, testing, and feedback from academic colleagues, I’m now making public the first version of the Atlas of Data Center Politics.
The Atlas currently brings together nearly 10,000 data center sites and campuses across 125 countries, more than 1,100 policy measures, and more than 2,400 political and development events. But rather than treating these as separate datasets, the design of the Atlas attempts to understand how data center development actually happens politically—via zoning, utility decisions, incentives, resource politics, permitting, environmental review, litigation, moratoria, resistance, finance, and the coalitions of firms and public institutions that make development possible.
For those interested in exploring the many dimensions of data center politics in the United States and globally, I hope you might take a look. Even in its current (still developing) form, it is quite revealing just how extensive the data center fight has become and how much it has grown since 2024.
Following the politics as it unfolds place-by-place
The most revealing (and important) layer of the Atlas is the events layer. Data center politics, like all politics, is a processual thing—moving through zoning and permitting hearings, utility negotiations, environmental reviews, lawsuits, protests, and sometimes cancellation or redesign. The Atlas currently includes over 2,400 political and development events across nearly 100 countries and organized into more than 700 place-based clusters.
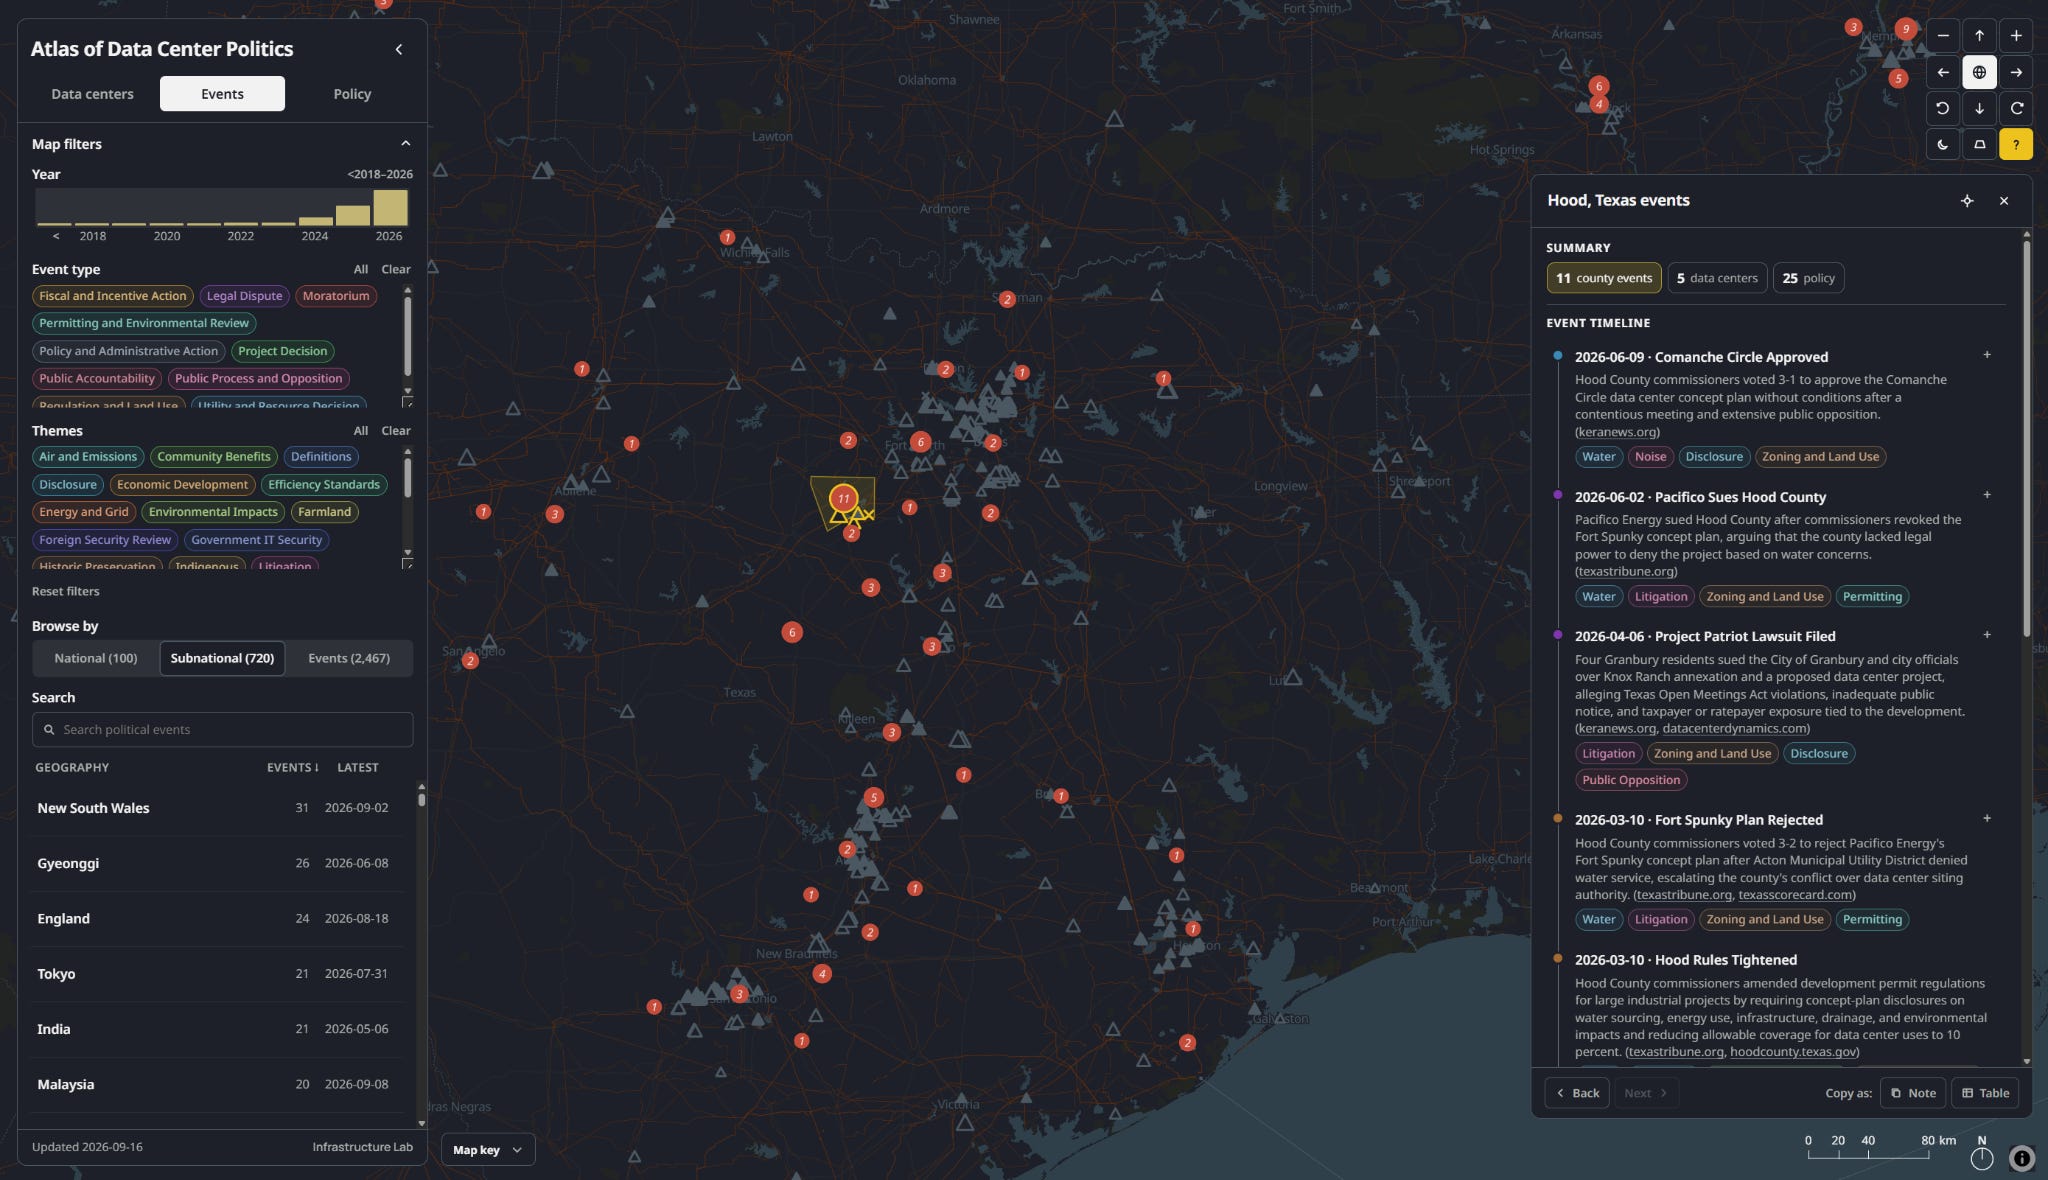
As a researcher, I needed a way to move beyond the endless stream of headlines in my inbox and see these events as both part of longer local trajectories and comparable patterns. Clicking into a place in the Atlas allows you to follow how a project changes over time and how different kinds of politics begin to emerge and evolve over time. A data center project may face various points of decision-making and resistance: rezoning requests, utility agreements, public hearings, organized opposition and litigation, or, increasingly as of late, a moratorium. In many cases projects move forward with little *visible* pushback, but in some places the politics may change a project substantially or result in rejection. Furthermore, the potential for comparison is important. Data center politics can look like a fight over water in Arizona, over electricity in Virginia, or land conversion in Malaysia, etc. The Atlas aims to make it much easier to place these cases alongside one another.
Mapping the data center projects and the coalitions behind them
The data center layer is one of the most conventional parts of the Atlas, although I have tried to make it do something slightly different from most data center trackers. It currently contains nearly 10,000 data center sites and campuses across 125 countries, including roughly 6,650 operating facilities and 3,000 planned projects, which includes anything that is under construction, permitted, or even a land bank. Where the evidence allows, records mostly include capacity ranges (based on both actual capacity reported as well as estimated based on various other metrics where this is not available), development stage, estimated opening year, operator, address, and source material (primarily URLs for now). The aim is to provide a reasonably well-sourced picture of where the buildout is actually happening and how quickly its geography is changing while addressing some of the issues that public data often include such as gaps in coverage and extraneous data (such as from OpenStreet Map).
Furthermore, a facility on a map only tells us so much. The coalitions of actors that make these projects possible are quite important for understanding data center development across multiple scales. A data center attributed to Microsoft, Google, Meta, Amazon, or a colocation operator will depend on a much larger network that includes utilities, developers, infrastructure funds, engineering firms, contractors, public agencies, and customers (at least one hopes). Moreover, in many cases the developer and operator are not even the same company while ownership can pass through multiple corporate entities, with financing and infrastructure responsibilities sit somewhere else.
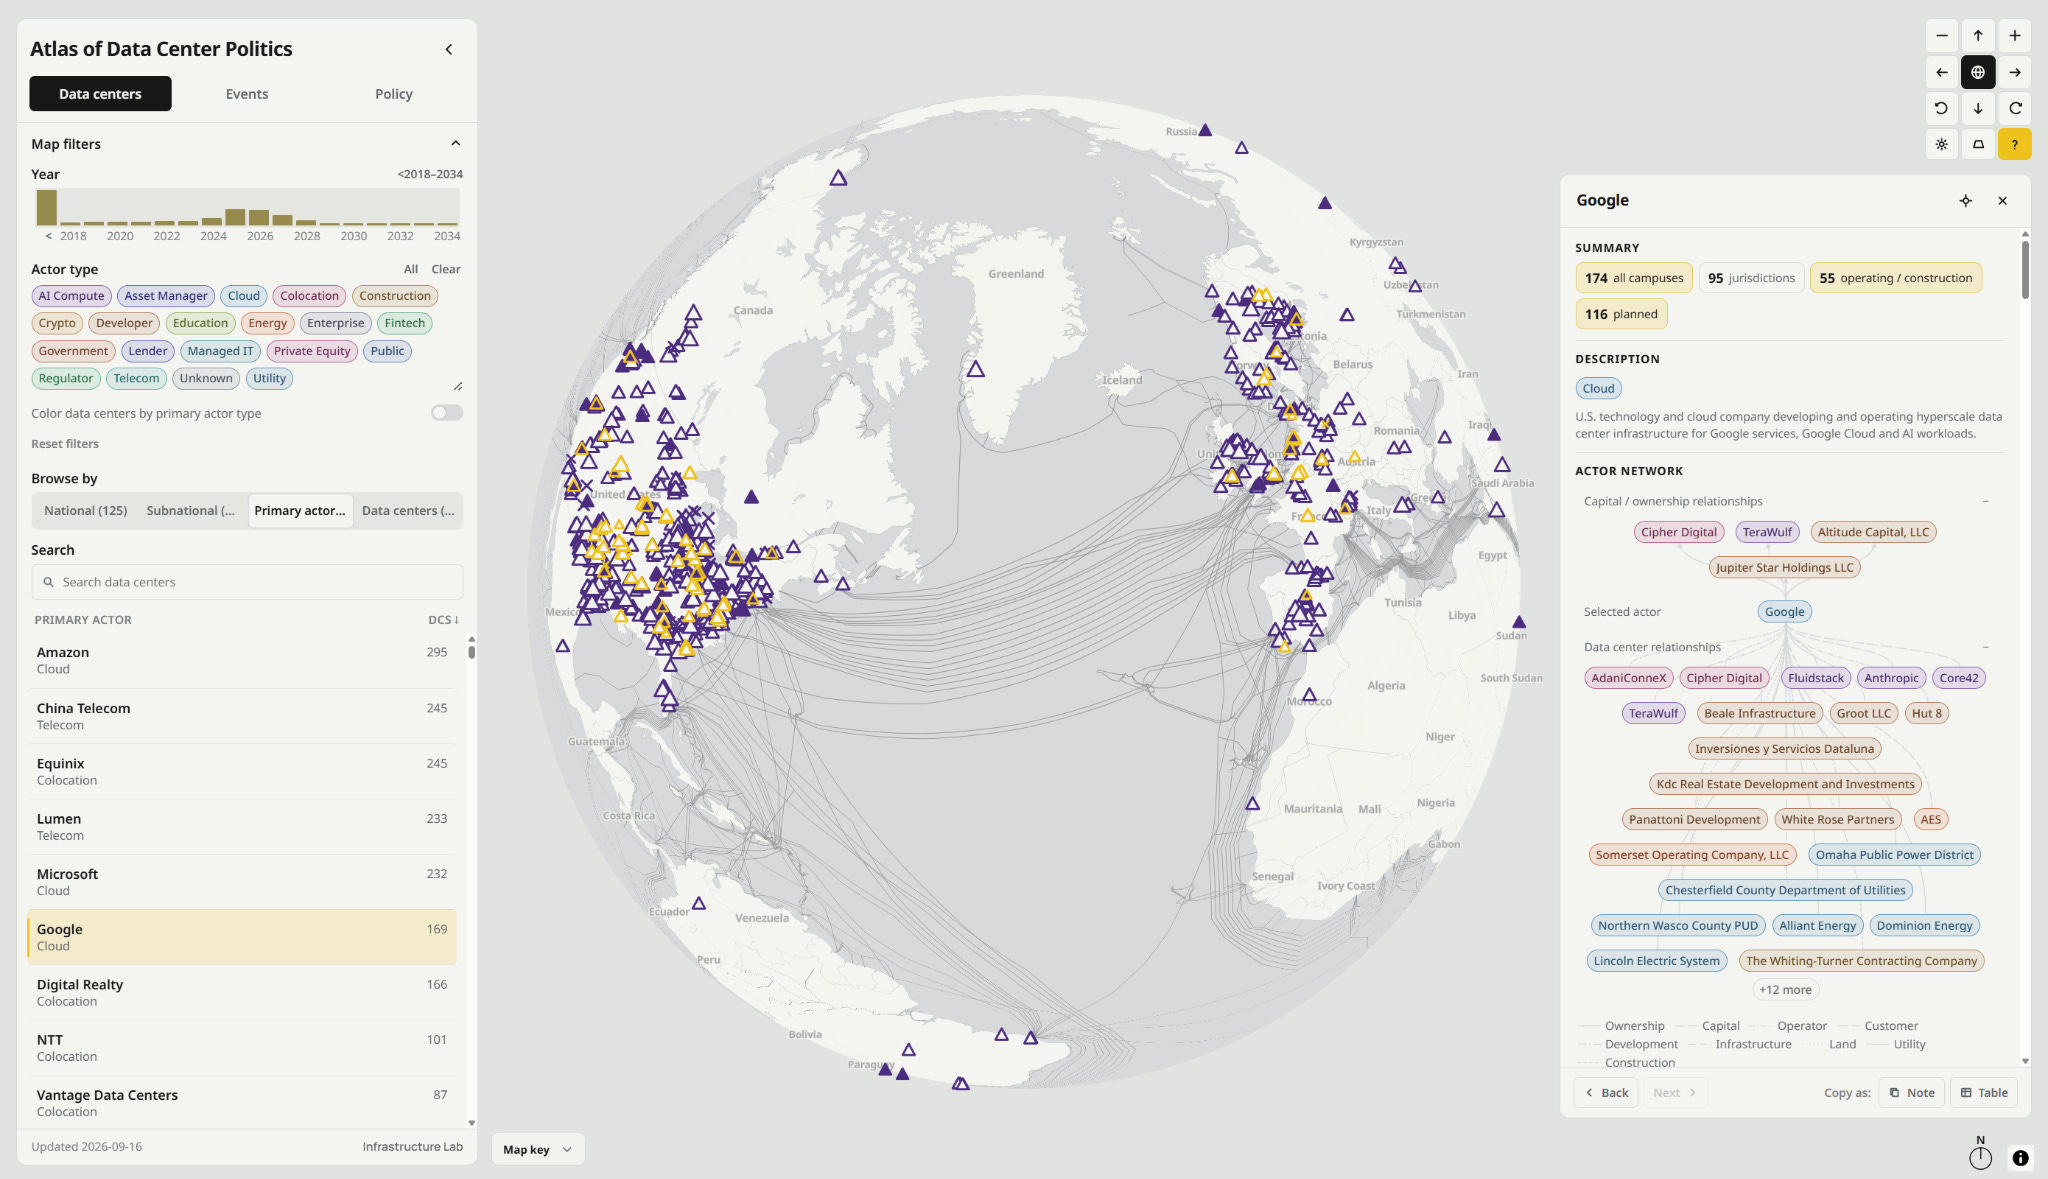
The Atlas therefore begins to connect individual facilities to this wider actor network. There are already more than 5,000 actors in the database, although this is the layer I would most clearly describe as a work in progress.
Tracking how governments are responding
The policy layer is important because it is becoming near impossible to talk about data center expansion as something governments were simply reacting to. In reality, governments are (and have been) actively constructing the conditions under which this development takes place.
The Atlas currently tracks more than 1,100 policy measures globally, including more than 850 in the United States alone. I covered some of this data work previously. These include bills, enacted legislation, regulations, executive measures, and other formal policy instruments among a few others. They cover everything from tax incentives and economic development, electricity and grid planning, water, ratepayer protections, permitting, disclosure, environmental impacts, zoning and land use, and efficiency standards—see ‘themes’ in the Atlas for a longer list that largely aligns with the events themes.
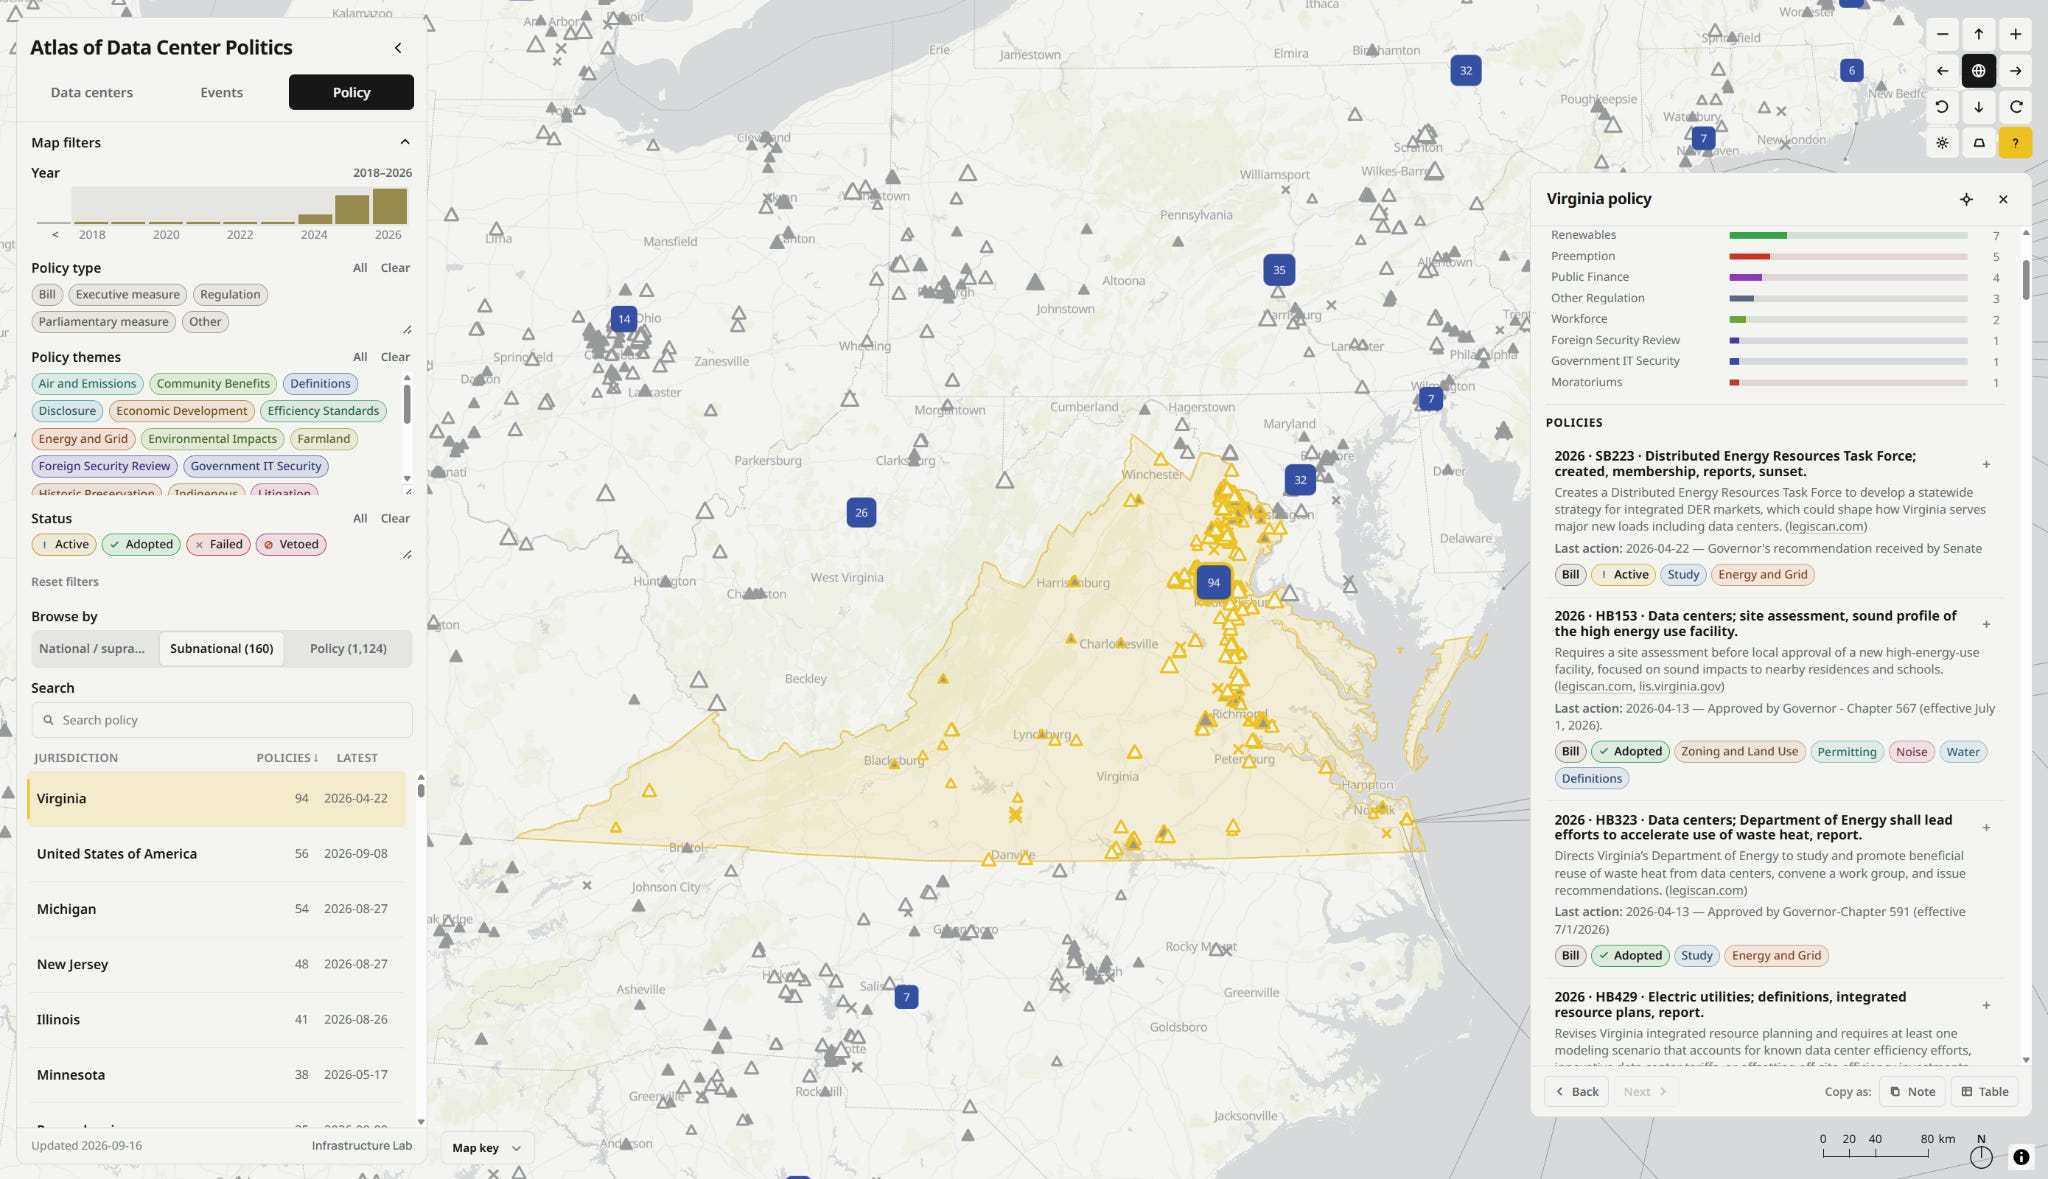
The breadth of this activity is quite surprising. The pre-2024 era of states offering tax exemptions to attract facilities is over. Since late 2025, legislatures and utility commissions have been debating who should pay for new transmission and generation, whether utilities can pass infrastructure costs onto existing ratepayers, and how much water use must be disclosed. Other consequential debates concern whether local governments can impose moratoria or if data centers should face different environmental or efficiency requirements from other large industrial loads.
The Atlas aims to make finding these differences more accessible. While some states have accumulated dozens of measures while others are relatively quiet. Interestingly, policies that begin in one jurisdiction also start appearing elsewhere in modified form (something I’d like to track more closely). At the same time, the growing international layer makes it possible to compare very different approaches to the same underlying pressures, from national planning and energy regulation to local restrictions on new development.
Putting these three layers together: the data center layer shows where development happens and who it’s led by; the events layer records what happens when those projects encounter particular places; and the policy layer shows what is actually being done (or not) in response.
I hope this will be a rich resource for those who are interested in exploring and comparing experiences across the United States and elsewhere. If you haven’t clicked the link to see the Atlas yet, please do! If you are a reporter or researcher interested in taking a closer look at the data or would otherwise like to collaborate on something concrete, please do reach out.
Keep up the great work!